You can access detailed, time-specific information about your stream’s revenue, audience, and engagement on the Channel Analytics page. Broadcasters can gain a more nuanced understanding of revenue and viewership trends with the help of this thorough research. To get to Channel Analytics, click the icon in the top right corner of your dashboard, go to the Insights page, and then choose the correct option from the drop-down menu.
The data collected over the past 30 days will be shown on the Channel Analytics page. You can advance or rewind the calendar by 30 days by using the arrows to the left and right of the current date. Select the date picker in the screen’s center, and then use the calendar that appears to select a starting date and an ending date that suits your needs.
How to see who’s watching your mobile twitch stream?
Follow these steps on your phone or tablet to find out who is watching your Twitch stream:
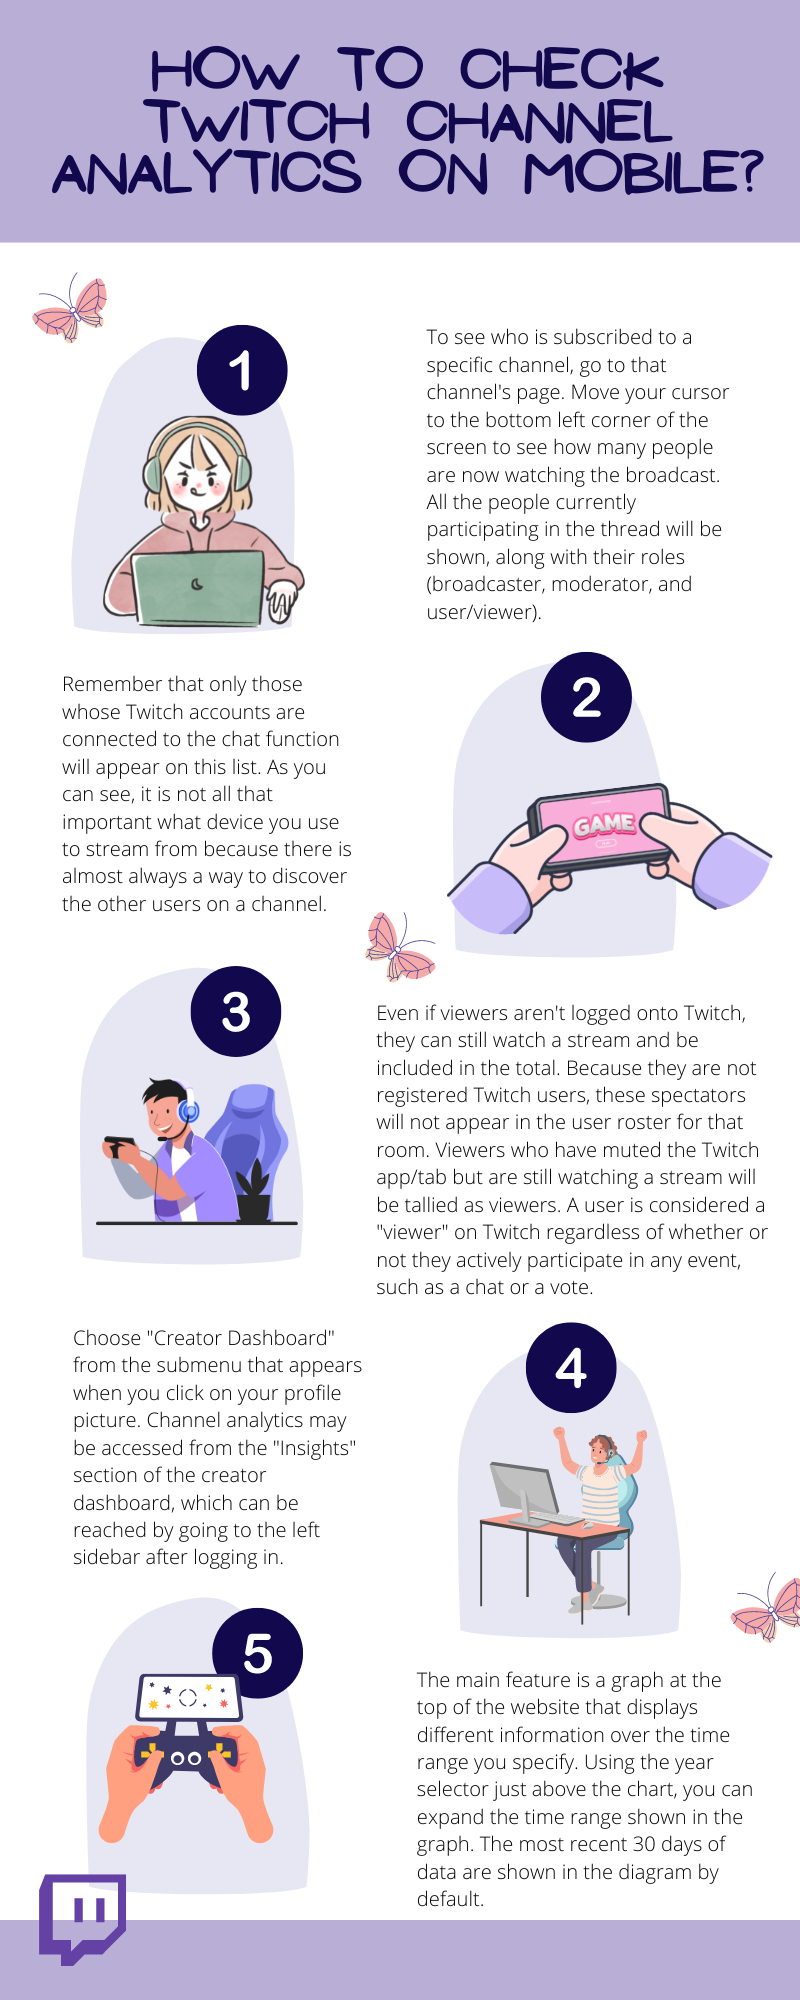
- To see who is subscribed to a specific channel, go to that channel’s page. Move your cursor to the bottom left corner of the screen to see how many people are now watching the broadcast. All the people currently participating in the thread will be shown, along with their roles (broadcaster, moderator, and user/viewer).
- Remember that only those whose Twitch accounts are connected to the chat function will appear on this list. As you can see, it is not all that important what device you use to stream from because there is almost always a way to discover the other users on a channel.
- Even if viewers aren’t logged onto Twitch, they can still watch a stream and be included in the total. Because they are not registered Twitch users, these spectators will not appear in the user roster for that room. Viewers who have muted the Twitch app/tab but are still watching a stream will be tallied as viewers. A user is considered a “viewer” on Twitch regardless of whether or not they actively participate in any event, such as a chat or a vote.
- Choose “Creator Dashboard” from the submenu that appears when you click on your profile picture. Channel analytics may be accessed from the “Insights” section of the creator dashboard, which can be reached by going to the left sidebar after logging in.
- The main feature is a graph at the top of the website that displays different information over the time range you specify. Using the year selector just above the chart, you can expand the time range shown in the graph. The most recent 30 days of data are shown in the diagram by default.

Twitch Analytics On Mobile
You may also select a different set of statistics to plot on the graph by clicking on the appropriate category header. Clicking the arrow next to the drop-down menu to the right of each heading allows you to make changes to that heading.
By changing the period and titles of the main graph, you can change the data shown to fit your needs. There’s a box labeled “Where did my views originate from?” on the left. When you click on this, you’ll see the several avenues by which your visitors found your stream. You’ll be taken to a more in-depth page with country and platform statistics if you click the “View Details” button in the box.
The “What were my top clips?” section is in the page’s extreme left-hand corner. Here you can see which videos were the most popular and how many times they were viewed over the time range you specified. A rundown of your broadcasts may be seen in the “What were my streams during this period” box on the page’s right side. In response to the query “Which channels have viewers in common with mine?” several channels that have had viewers in common with mine are displayed and then ordered by the most significant proportion of viewers they share. You can learn much about improving your stream by watching channels with a large audience similar to yours. The other fields provide data relevant to your stream.
